

Third and final in a series. Part 1 showed where the “forever chemicals” are. Part two follows the money. This one covers road salt.
In the early 1990s, the water Kingston pumped out of the ground carried about 6 milligrams of sodium per liter. It was, by any measure, fresh.
Today Kingston’s water averages 43 — seven times what it was. The town has done nothing wrong. No regulator has cited it. No public notice has gone out. Kingston is not in violation of anything, because there is nothing to violate.
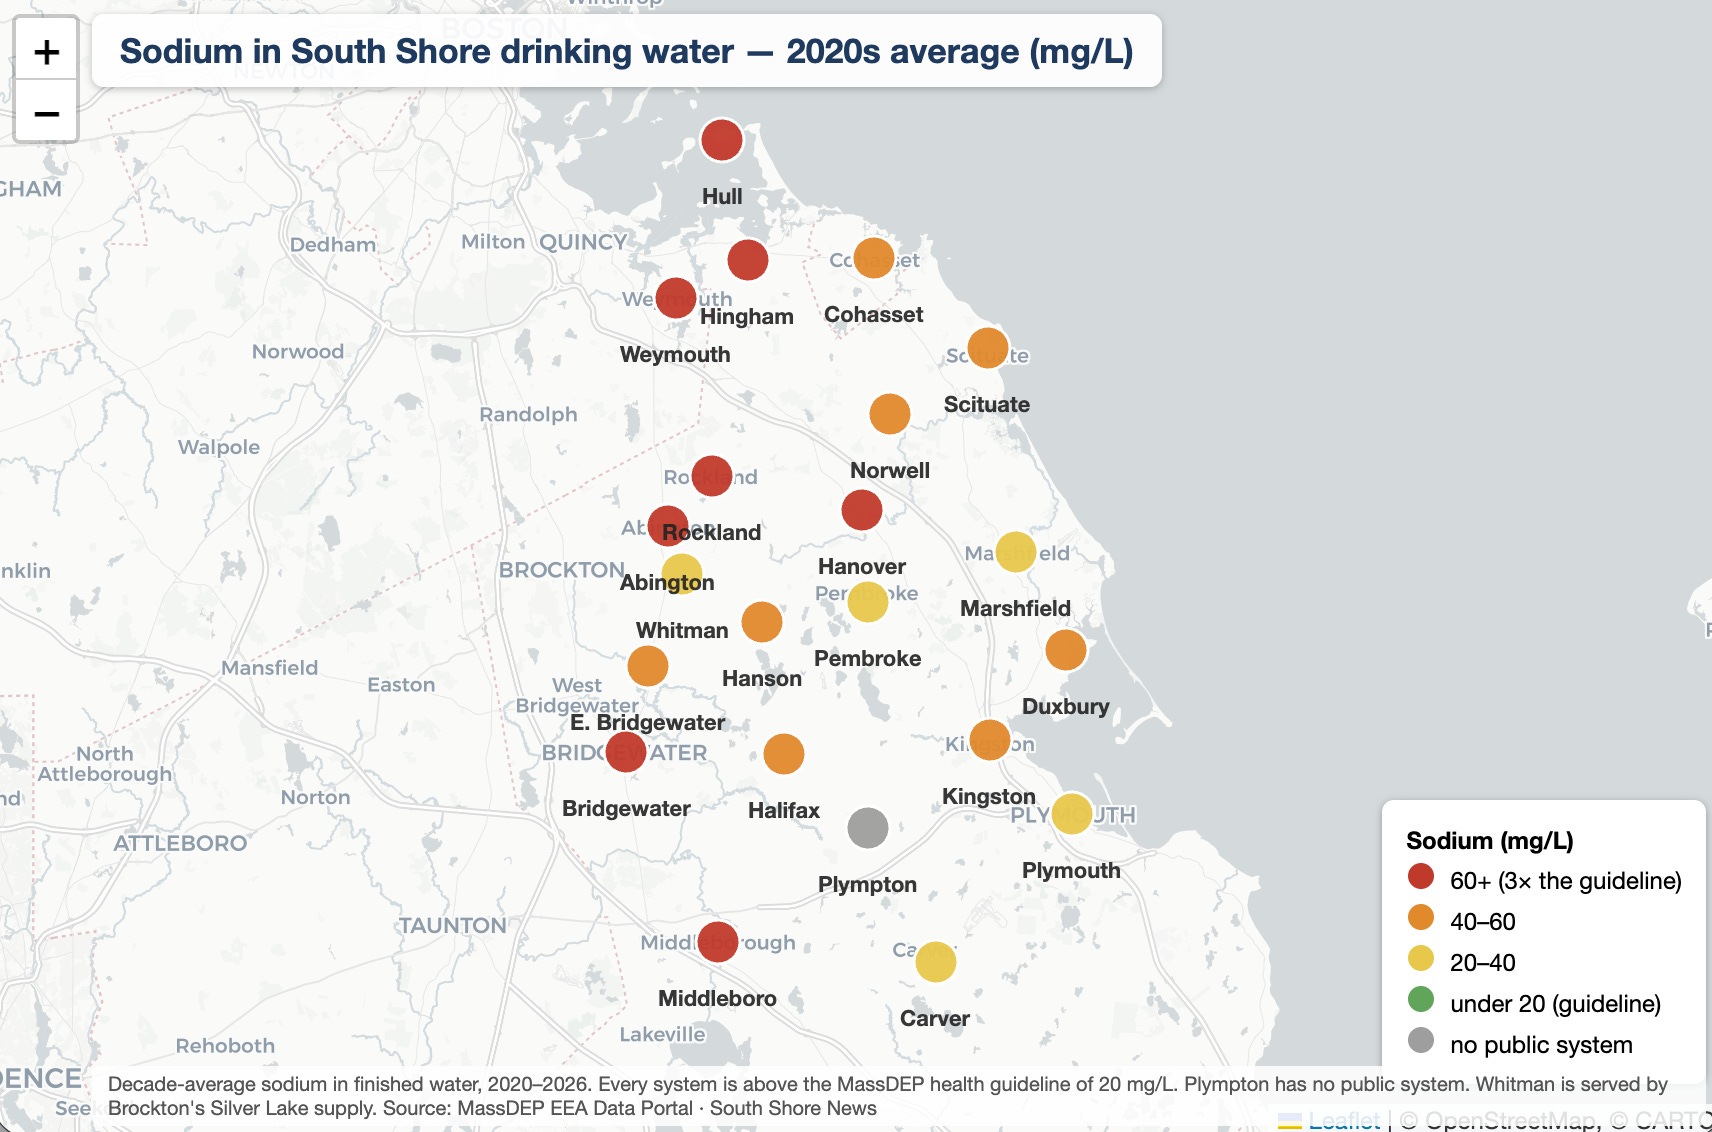
The same is true in all 22 towns this series has examined. Every public water system on the South Shore now exceeds the state’s health guideline for sodium in drinking water — and has for years. In the 2020s, not one of the region’s 19 reporting systems averages below 35 milligrams per liter. The state’s guideline is 20. The range across the region runs from 35 to 98, roughly two to five times the guideline.
And every one of those towns is in full compliance with federal and state drinking water law.
The scale is easier to grasp against the state’s own benchmark. When MassDOT studied sodium statewide, it found 52% of water systems close to a state road averaged above the 20 mg/L guideline. On the South Shore, the figure is 100%. Above 40 mg/L — double the guideline — MassDOT found 28% of near-road systems statewide; here it is 79%. The region isn’t just over the line. It is well above the statewide norm.
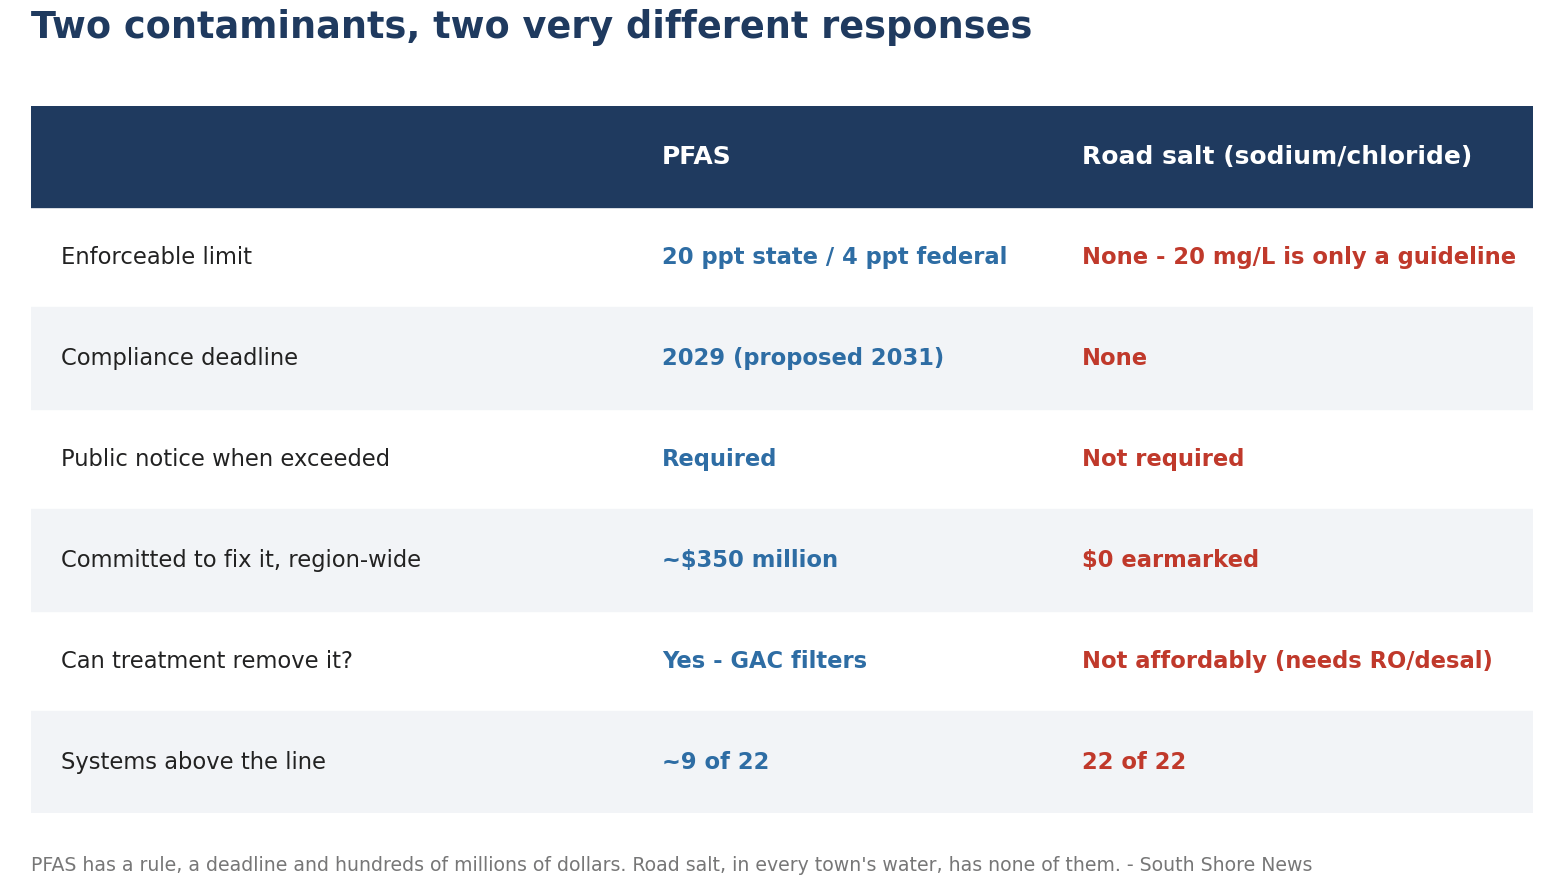
The first two parts of this series were about PFAS — [Part 1] [Part 2] — a contaminant with a legal limit, a compliance deadline and something on the order of $350 million committed across the region to remove it. Part 3 is about the opposite problem. Road salt has been accumulating in the South Shore’s aquifers for three decades, in every town, in quantities the state itself has documented. It has no limit, no deadline and no money.
Why nobody is in violation
The 20 mg/L figure is not a standard. It is an Office of Research and Standards Guideline — MassDEP’s advisory level, written into the state’s drinking water regulations at 310 CMR 22.16A. It exists for a specific group of people: those on a physician-prescribed low-sodium diet of no more than 500 milligrams a day. It carries no enforcement.
The federal picture is thinner still. EPA set its original sodium guidance at 20 mg/L in 1980. Eight years later, in 1988, EPA removed sodium from the list of contaminants to be regulated under the National Primary Drinking Water Regulations. It has never gone back. In 2003, the agency issued a revised recommendation of 60 mg/L — and made it explicitly on the grounds of taste, not health, reasoning that the sodium people get from food dwarfs what they get from water.
Chloride, road salt’s other half, has a federal number too: 250 mg/L. It is a secondary standard, which in practice means aesthetic and unenforceable. Kingston’s Winthrop Street well has topped it in five separate sampling rounds, reaching 424. Scituate’s Minot source hit 317. Middleborough’s East Grove Street well has crossed it twice — and that is the very well the town is now spending $33 million to treat for PFAS. One well, two contaminants, and a standard that could only stop one of them. Nothing followed on the chloride, because nothing was required to.
So a South Shore town can sit at five times the health guideline for thirty years, report the number accurately in its annual water report every single year, and never once be out of compliance.
That is not a loophole anyone is exploiting. It is simply the absence of a rule.
The thirty-year climb
The state's own sampling records go back to 1993, and they tell a consistent story. Sodium, averaged across all finished-water samples reported in each decade, in milligrams per liter:
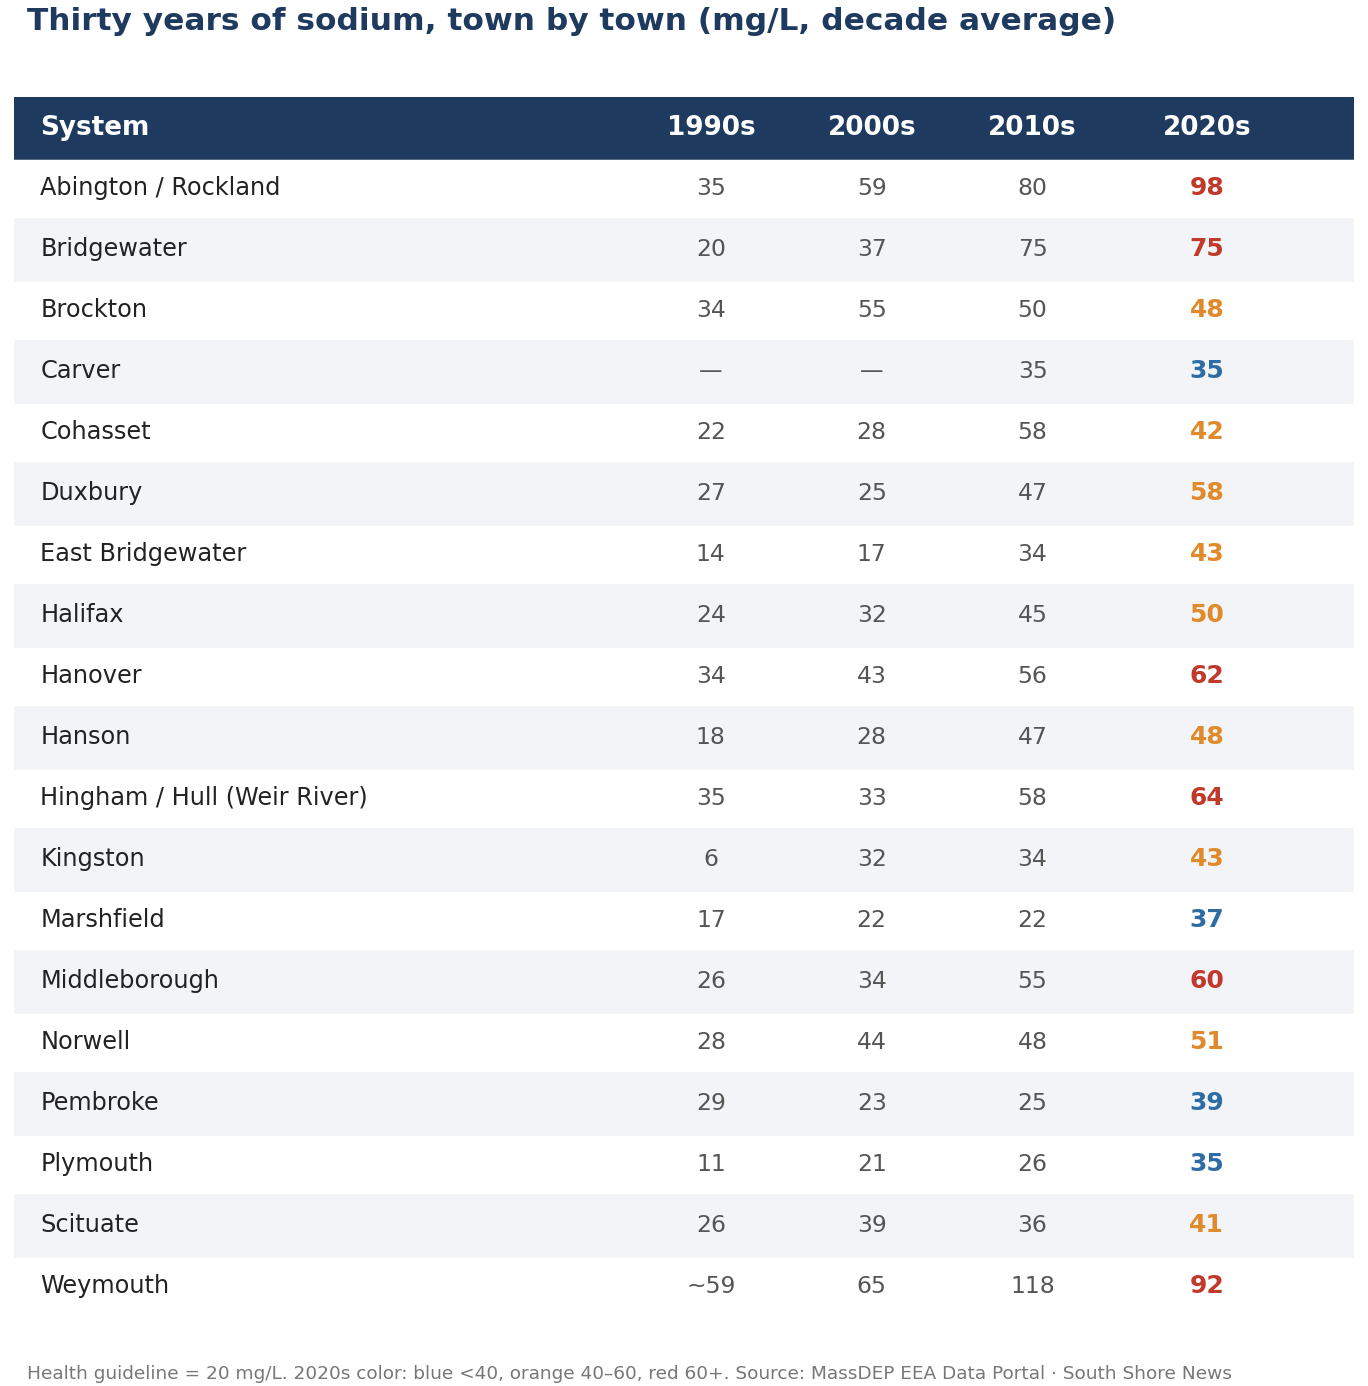
Plympton has no public water system. Whitman buys its water from Brockton.
Six systems were at or below the 20 mg/L guideline three decades ago — Bridgewater at 20, East Bridgewater at 14, Hanson at 18, Kingston at 6, Marshfield at 17 and Plymouth at 11. Every one of them has since doubled, tripled or worse. Bridgewater is up nearly fourfold. East Bridgewater has tripled. Plymouth, the cleanest town in the region for PFAS, has tripled too.
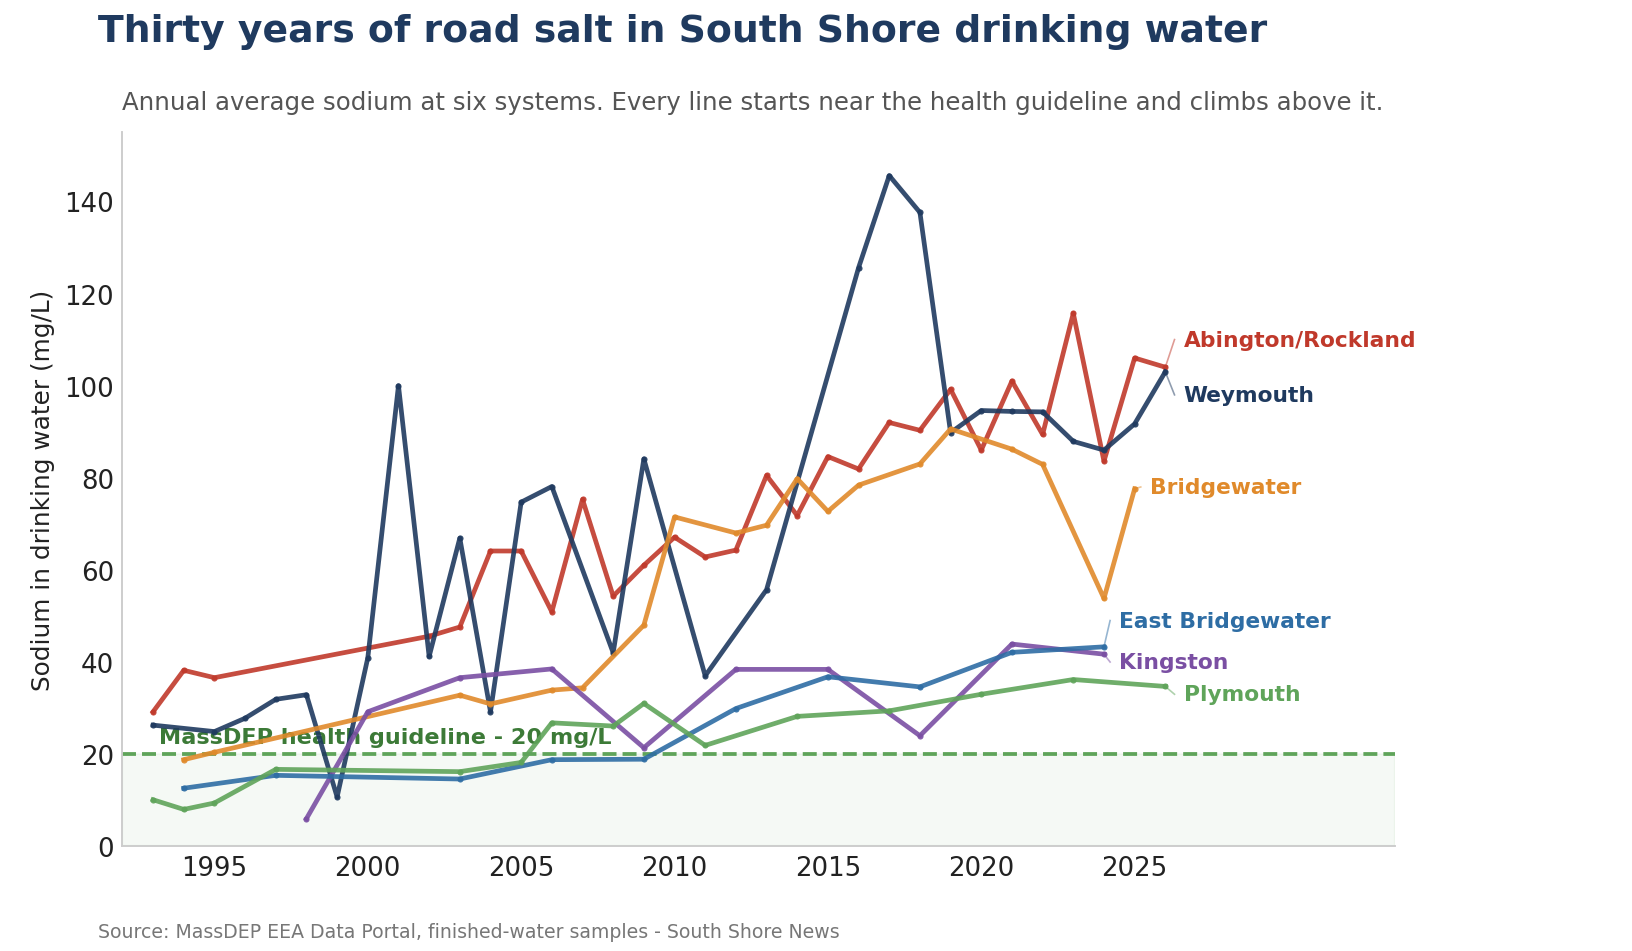
Nothing in the record suggests a single event. There was no spill, no plume, no responsible party. There is just a line that goes up, year after year, in nearly every town, for thirty years.
Where it comes from — and who spreads it
Road salt is the obvious suspect, and the state has investigated itself on exactly this question.
In its 2022 Snow and Ice Control Program environmental report, MassDOT compared sodium in public water systems by their distance from a state road. It found that 52% of systems within a half-mile of a MassDOT road average above 20 mg/L, against 34% of those farther away. Above 40 mg/L, the split is 28% versus 15%. And the gap has widened over time: between the early 1990s and the late 2010s, the share of near-road systems averaging above 25 mg/L roughly doubled, from about 25% to about 50%.
The same report names Weymouth among the municipal water supplies with the highest sodium levels in Massachusetts. Our own analysis found the same thing independently: Weymouth’s Bilodeau treatment plant has repeatedly reported sodium between 208 and 280 mg/L, the highest sustained readings anywhere in the region.
But MassDOT’s report also complicates the picture. When the agency ran a regression between sodium levels and distance to a state road, the correlation was weak — the strongest R² value was 0.053, meaning distance from a state highway explained only about 5.3% of the variation between systems. Sodium rose in water systems far from state roads too. And it kept rising even as MassDOT cut its own salt use, from 33.4 tons per lane-mile in the 2000s to 23.0 today, roughly a quarter less. The agency points to urbanization, and to all the other places salt comes from: parking lots, private plow contractors, water softeners, septic systems.
South Shore News tested this directly. Using the state’s own map of permitted water-supply sources, we measured how far each of the region’s public wells sits from the nearest major road, and checked it against that well’s sodium. The result matched MassDOT’s: distance to a major road explained only about 6% of the variation between wells — statistically almost nothing. Wells within 250 meters of a major road averaged 42 mg/L of sodium; wells farther away averaged the same 42. A few of the closest sources are among the saltiest — Middleborough’s East Grove Street well, 77 meters off a state road, runs above 110 — but for every one of those there is a well just as close reading a clean 18.
The lesson is not that road salt is innocent. It is that road salt is everywhere, and you cannot pin the region’s sodium on the state highways alone. Which points at a simpler fact buried in the numbers. MassDOT maintains about 16,100 lane-miles — roughly 20% of the roads in Massachusetts. Municipalities maintain the other 80%. The dense grid of town and residential streets never shows up in a “distance to the highway” test, and that is where most of the salt goes down.
The largest single salt applicator on the South Shore, in other words, is not the state. It is the towns — the same towns now assembling $350 million to take PFAS out of the water are, every winter, putting salt into it.
And the towns spend real money doing it. Across the 22 communities, snow and ice removal ran about $8.8 million a year on average from fiscal 2022 through 2025 — and topped $11 million in each of the two hard winters, 2022 and 2025. That is the budget for putting salt down. There is no line item anywhere for taking it back out of the water.
The one budget a town is allowed to blow
Snow and ice is unlike any other line in a municipal budget. Under state law — G.L. c. 44, § 31D — a town may legally overspend its snow-and-ice account without asking Town Meeting first. Every other department has to live within its appropriation; snow and ice does not. When the money runs out mid-winter, the plows keep rolling, and the overage is simply added to the next year’s tax recap, no vote required.
There is one condition. To unlock that power, the town’s snow-and-ice appropriation for the current year has to be at least as large as the previous year’s original budget. In practice that rewards keeping the number flat and low: budget a modest figure, meet the legal floor, and let the winter — and next year’s taxpayers — settle the rest.
The data suggests that is exactly what many towns do. In 13 of the 22 communities, the average snow budget over the last four years was set below what the town typically spends. In 52 of 88 town-years, actual spending blew past the original budget. And over four years, South Shore towns quietly overspent roughly $4.3 million in snow-and-ice deficits.
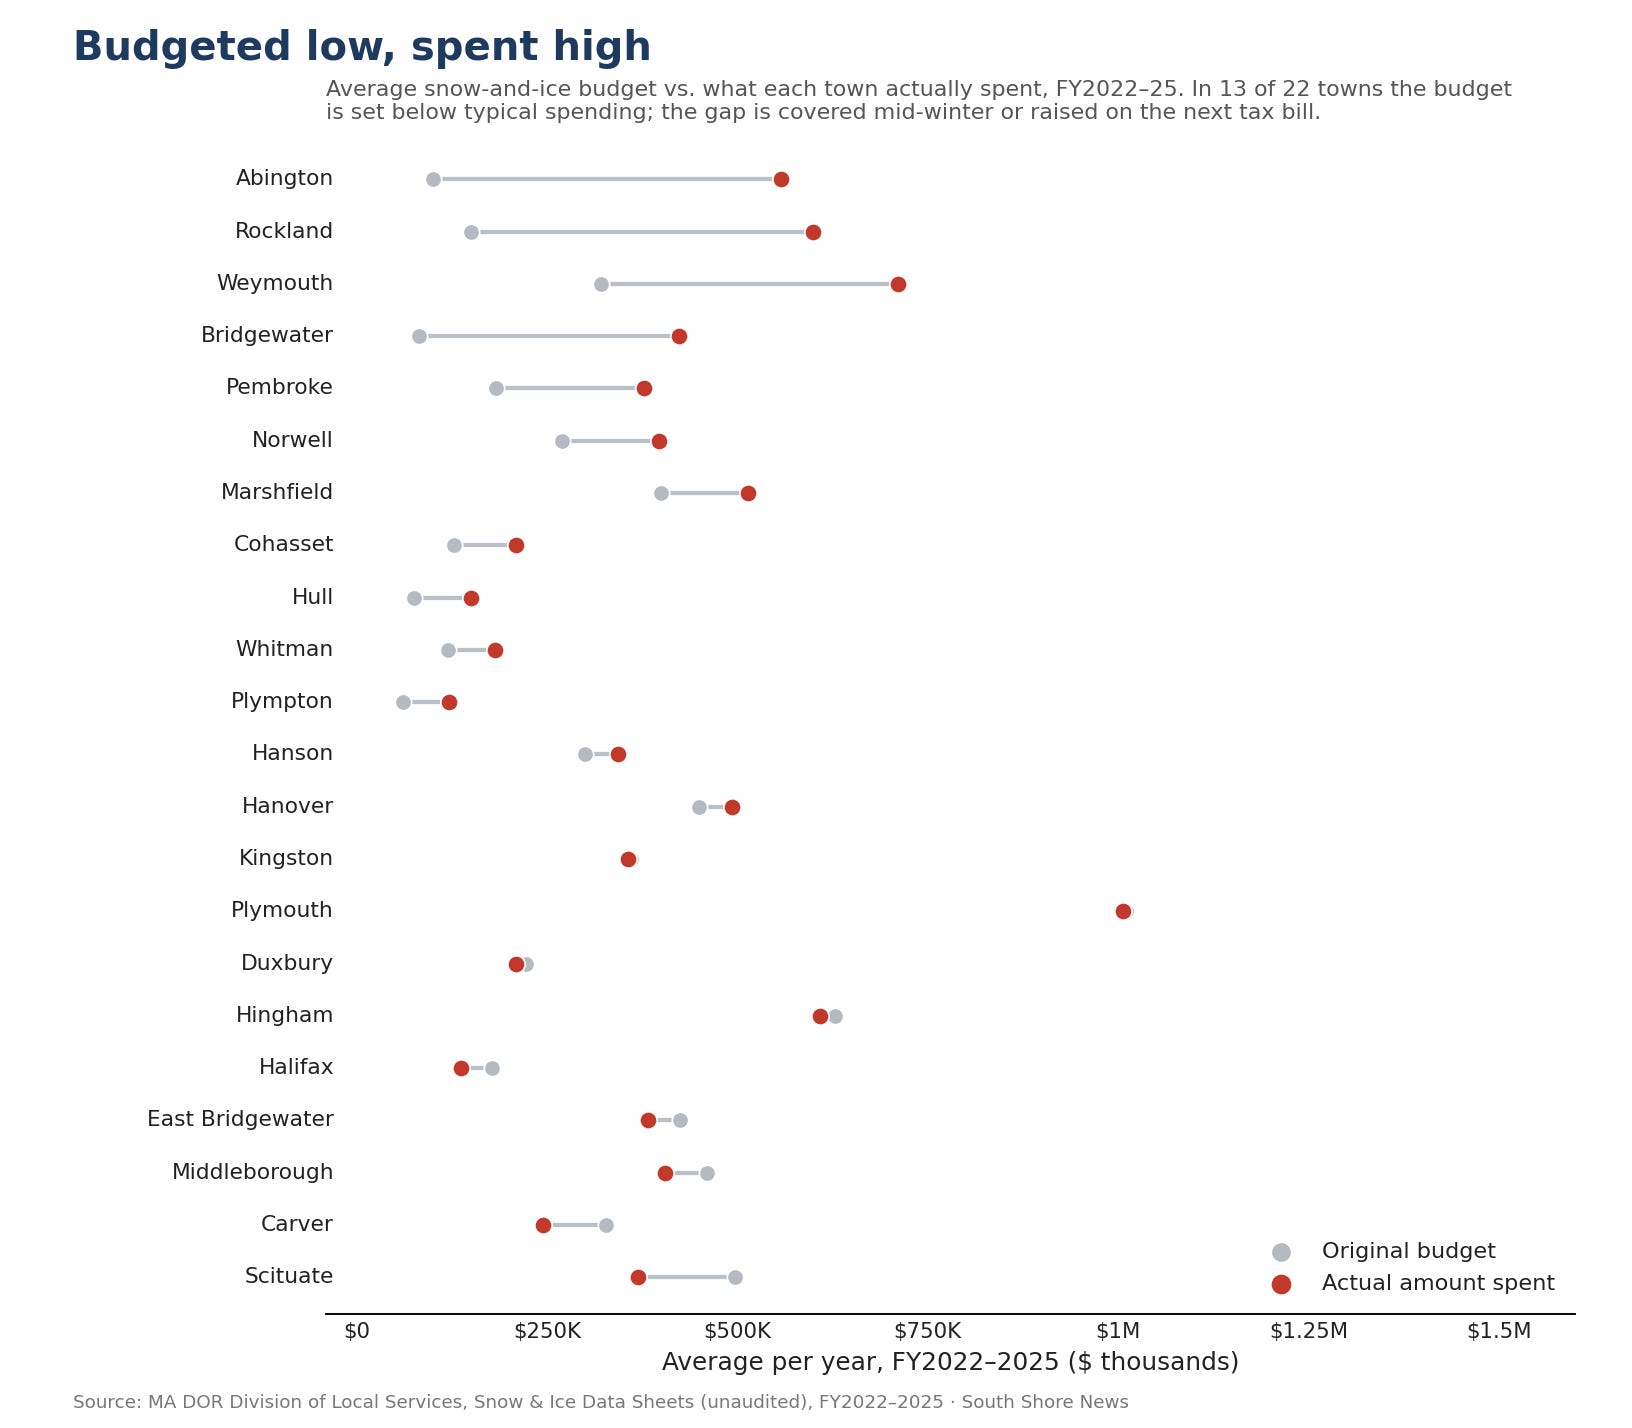
The clearest cases are hard to miss. Bridgewater budgets about $82,000 a year for snow and ice and has spent an average of $423,000 — running a deficit in all four years and shifting roughly $1.36 million onto its taxpayers. Abington budgets a flat $100,000 and spent $768,000 in fiscal 2025 alone. Weymouth carried a $320,000 budget into last winter and then piled on a $1.45 million supplement to cover the $1.77 million it spent — the biggest single-year snow bill in the region, in the town with its saltiest water.
None of this is illegal, and none of it is hidden; the state collects the figures every year. Town officials may have sound reasons for budgeting conservatively, even if just to maintain the ability to deficit spend. But the pattern is consistent, and it points to something the rest of this story keeps circling: getting salt onto the roads is easy to pay for, through a mechanism the law bends over backwards to allow. Getting it out of the water has no mechanism at all.
*editor’s note: snow and ice removal spend is publicly available and used as a proxy for road salt applied. It’s not quite that simple but should be a good approximate.
The zones that were supposed to protect the water
MassDOT designates Reduced Salt Zones over sensitive water resources — stretches of highway where crews are supposed to use less salt to protect what is underneath.
By the agency’s own account, the program did not work as intended. Its 2022 report says the old practice of spreading a 50:50 sand-and-salt mix in those zones was “often ineffective” at keeping ice from bonding to pavement, so crews had to come back and apply more. The result, in MassDOT’s own words, was that the salt used in reduced-salt zones over a season “could often be as much or even more than that used on adjacent roads” — especially in severe winters.
MassDOT is now phasing sand out of those zones in favor of pretreating roads and prewetting salt. But the admission stands: for years, the state’s designated water-protection zones may have been receiving as much salt as everywhere else, or more.